 Everybody knows working from home offers a ton of benefits. No commute (which can save you a ton of money), no office politics, and (best of all) no need to get dressed for work.
But what’s often overlooked is the fact that working from home also gives you a massive amount of extra free time.
Data from the Bureau of Labor Statistics shows full-time workers who work from home spend about 28% less time each day working than those who go into the office, but not only that, at-home remote workers don’t have to spend time commuting each day either.
That got us wondering — just how much extra free time does working from home give you each year?
We ran the numbers, and the results were pretty shocking.

On average, full-time employees who work from home will have exactly 777 hours, 46 minutes, and 9 seconds of extra free time each year compared to their office-bound counterparts.
That’s the equivalent of over 32 days of extra time that remote workers get to enjoy however they want.
Read on for a full breakdown of the numbers.
Our Findings
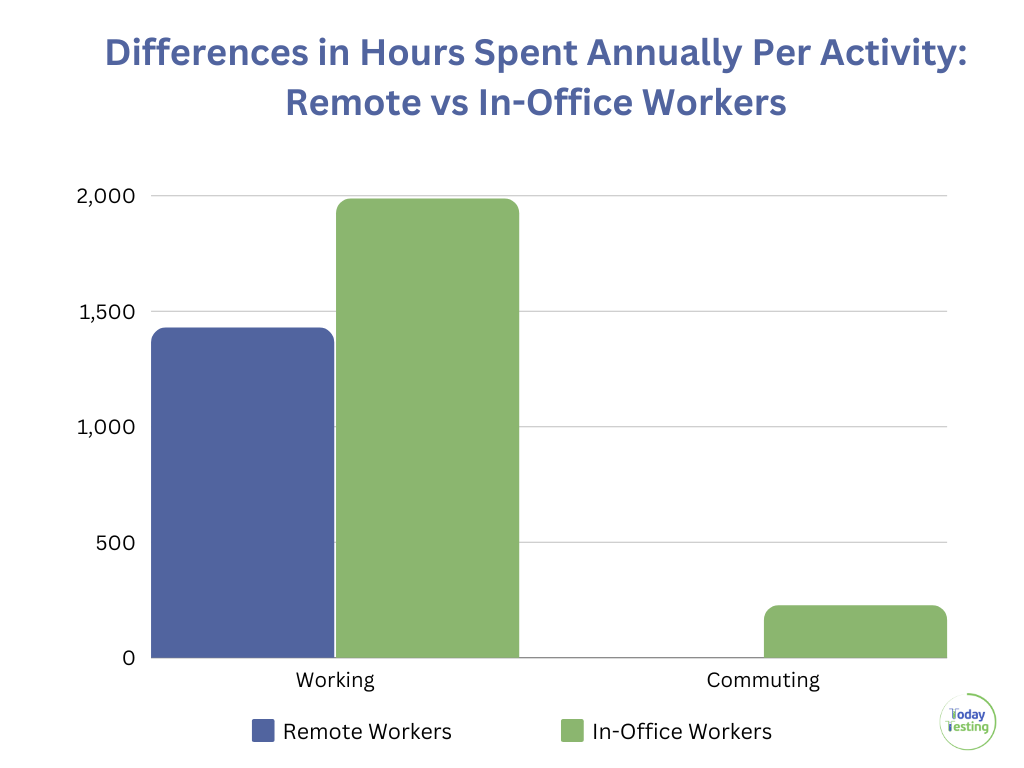
According to the Bureau of Labor Statistics most recent American Time Use Survey, full-time employed individuals who work from home put in an average of 5.88 hours per day. That’s about 5 hours and 53 minutes. On the other hand, full-time employed individuals who go into an office work an average of 8.18 hours per day. That’s about 8 hours and 11 minutes.
What that means is that people working from home work an average of 2 hours and 18 minutes less each day than those who commute to an office. That’s a difference of 11.5 hours each week.
Now, obviously, not everyone works a full 8+ hours when they’re at the office, but the point is they still spend that time away from home in the office.
On top of that, the American Community Survey Report from the US Census Bureau found that the average commute for US workers is now 27.6 minutes each way or 55.2 minutes round trip each day. People working from home don’t have to commute, so they save all of that time by not sitting in traffic or on the train.
When you add it all up, full-time workers who are remote and work from home get an extra 16.1 hours of free time each week, or 777 hours, 46 minutes, and 9 seconds over the course of a year. That’s the equivalent of over 32 days of free time that remote workers get to enjoy however they want.
If you stretched that out over a 45-year career, someone who worked from home would get an extra 1,458 days or roughly 4 years of extra free time compared to someone working in an office their whole career.
With such eye-popping data, it’s no wonder 87% of Gen Z workers say they want to work remotely and view it as a top perk.
Where do workers stand to save the most time working remotely? Here are the top 20 metro areas where workers lose the most free time by working in an office.
| City | Annual Hours Spent Commuting | Extra Annual Hours Spent Working & Commuting vs Remote Workers | Days Worth Of Free Time Lost By Working In Office vs Remotely Over Lifetime |
| East Stroudsburg, PA Metro Area | 312 hrs | 870 hrs | 1632 days |
| New York-Jersey City-White Plains, NY-NJ Metro Division | 300 hrs | 858 hrs | 1610 days |
| New York-Newark-Jersey City, NY-NJ-PA Metro Area | 291hrs | 849 hrs | 1593 days |
| Silver Spring-Frederick-Rockville, MD Metro Division | 280 hrs | 838 hrs | 1572 days |
| Washington-Arlington-Alexandria, DC-VA-MD-WV Metro Area | 278 hrs | 836 hrs | 1568 days |
| Washington-Arlington-Alexandria, DC-VA-MD-WV Metro Division | 278 hrs | 836 hrs | 1568 days |
| Picayune, MS Micro Area | 275 hrs | 833 hrs | 1563 days |
| Dutchess County-Putnam County, NY Metro Division | 274 hrs | 832 hrs | 1561days |
| Oakland-Hayward-Berkeley, CA Metro Division | 271hrs | 829 hrs | 1555 days |
| Nassau County-Suffolk County, NY Metro Division | 270 hrs | 828 hrs | 1553 days |
| Bogalusa, LA Micro Area | 268 hrs | 826 hrs | 1550 days |
| Newark, NJ-PA Metro Division | 265 hrs | 823 hrs | 1544 days |
| Chicago-Naperville-Arlington Heights, IL Metro Division | 261hrs | 819 hrs | 1536 days |
| San Francisco-Oakland-Hayward, CA Metro Area | 260 hrs | 818 hrs | 1535 days |
| Boston, MA Metro Division | 259 hrs | 817 hrs | 1533 days |
| Shelton, WA Micro Area | 258 hrs | 816 hrs | 1531days |
| Riverside-San Bernardino-Ontario, CA Metro Area | 257 hrs | 815 hrs | 1529 days |
| Philadelphia, PA Metro Division | 255 hrs | 813 hrs | 1525 days |
| Fernley, NV Micro Area | 254 hrs | 812 hrs | 1523 days |
Our Methodology
Here’s how we came up with our calculations.
We started with the assumption that the average American works 242.8 days per year. We got that by multiplying 52 weeks x 5 days a week and then subtracting the 17.2 days of vacation workers take per year on average.
Then we used data from the Bureau of Labor Statistics showing time spent working each day by employed persons working at home and in the workplace. We also factored in data from the US Census Bureau on average commute times across the country.